

Getting started
When working with Azure for a while and your environments have matured over a period of time, you will be able to look into usage and utilisation of Azure resource to see if they are being used adequately or maybe they are just idle all the time, but you are spending honderds if not thousands on these resources per month or year.
To combat this it is good to have insides in these resources and check their usage and utilisation over a set period, so you know when take action. Of course this does not only apply to reducing costs but just as well as knowing when something might need to upgrade as it might be utilised to its full capacity.
As always I got a Logic App for this, which allows you to check services and see how they are utilised. In this blog it is scoped towards Azure SQL Database, but the same principal applies to most other services!
Lets have a look!
Prerequisites
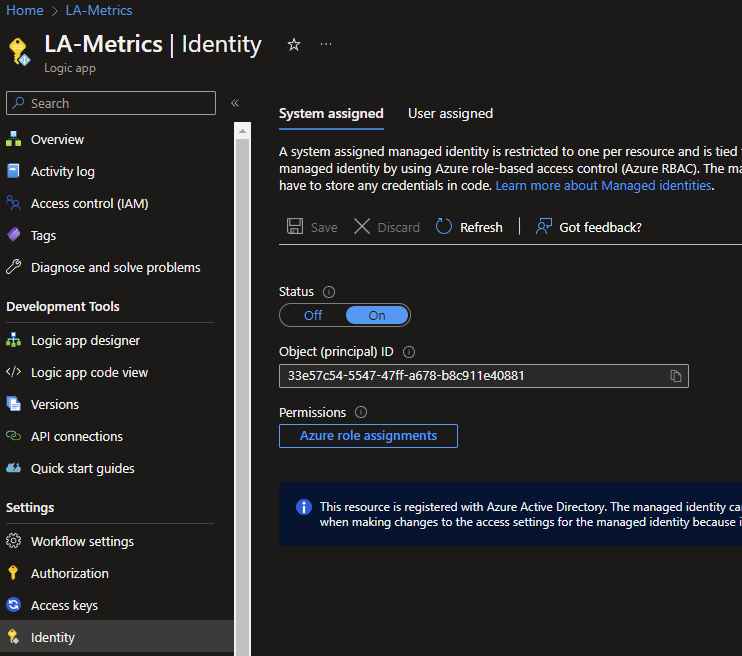
Before we start we will need two things in place, first up is a blanc Logic App with System Assigned Identity (MSI) enabled. If you don't know how to make these, check out one of my earlier blogs in which I show this step by step.
Secondly, in all cases an Azure SQL Database is needed, as we will be storing the results of our measurements in it. Below you will find a script to add your Logic App to the Database, create a table specific to the scope of this blog (Azure SQL Databases) and a Stored Procedure which ingests JSON data from the Logic App and inserts it into the table. This Stored procedure is made modulair and can be reused for multiple serives by just adding them in the same way as it is done for the azuresqldb.
Note: Change LA-Metrics] into the name of your Logic App!
With everything in place, you should be good to go and continue!
CREATE USER [LA-Metrics] FROM EXTERNAL PROVIDER;
ALTER ROLE db_owner ADD MEMBER [LA-Metrics];
GO;

CREATE TABLE [dbo].[sqlDatabaseUtilization](
    [resourceGroupName] [nvarchar](300) NOT NULL,
    [sqlServerName] [nvarchar](100) NOT NULL,
    [sqlDatabaseName] [nvarchar](100) NOT NULL,
    [skuName] [nvarchar](100) NULL,
    [minCapacity] NUMERIC(11,2) NULL,
    [maxCapacity] [int] NULL,
    [autoPauseDelayInMinutes] [int] NULL,
    [maxCpuPercentage] [int] NULL,
    [storagePercentage] [int] NULL,
    [percentageIdle] NUMERIC(11,2) NULL,
    [transactionDate] [date] NOT NULL,
    [resourceID] nvarchar(300) NOT NULL,
    [totalMeasurements] [int] NULL
PRIMARY KEY CLUSTERED ( [transactionDate] ASC,  [resourceID] ASC)
)
GO;

CREATE PROCEDURE dbo.MetricMeasurements
@JSON NVARCHAR(max),
@SERVICE NVARCHAR(32)

AS

IF 'azuresqldb' = REPLACE(LOWER(@SERVICE),' ','') --Remove spaces and make sure string is always lowercase formatted
BEGIN
;WITH azuresqldb as (
SELECT
    [resourceGroupName]
    ,[sqlServerName]
    ,[sqlDatabaseName]
    ,[skuName]
    ,[minCapacity]
    ,CEILING([maxCapacity]) AS maxCapacity
    ,[autoPauseDelayInMinutes]
    ,CEILING([maxCpuPercentage]) AS maxCpuPercentage
    ,CEILING([storagePercentage]) AS storagePercentage
    ,[percentageIdle]
    ,[transactionDate]
    ,[resourceID]
FROM OPENJSON(@JSON)
WITH (
    [resourceGroupName] [nvarchar](300) '$.resourceGroupName',
    [sqlServerName] [nvarchar](100) '$.sqlServerName',
    [sqlDatabaseName] [nvarchar](100) '$.sqlDatabaseName',
    [skuName] [nvarchar](100) '$.skuName',
    [minCapacity] NUMERIC(11,2) '$.minCapacity',
    [maxCapacity] [int] '$.maxCapacity',
    [autoPauseDelayInMinutes] [int] '$.autoPauseDelayInMinutes',
    [maxCpuPercentage] [int] '$.maxCpuPercentage',
    [storagePercentage] [int] '$.storagePercentage',
    [percentageIdle] NUMERIC(11,2) '$.percentageIdle',
    [transactionDate] [date] '$.transactionDate',
    [resourceID] nvarchar(300) '$.resourceID',
    [totalMeasurements] [int] '$.totalMeasurements'
))

INSERT INTO [dbo].[sqlDatabaseUtilization]
SELECT * FROM azuresqldb
END

GO;
The Logic App
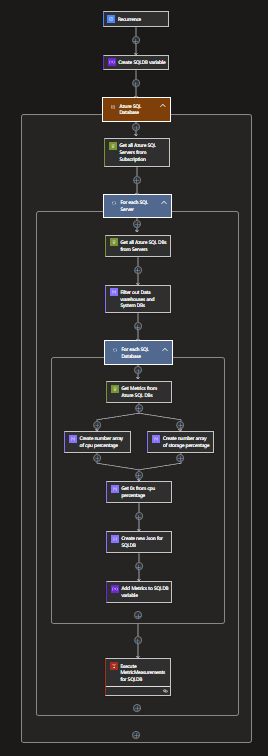
With the basics setup we can now continue with the actual flow of the Logic App. Below you will find a complete overview of how the Logic App flow looks like when completed. Note: This is just for a single utilisation flow, but this whole process can be replicated for all other kinds like SQL Pools, Web Apps, Data Bricks etc. Basically everything that has compute resources and is accessible via the Management API for Insights/ Metrics can be tracked this way.
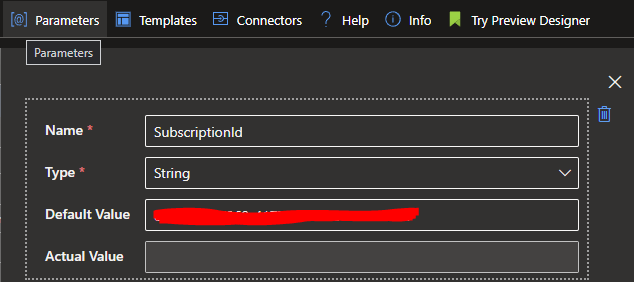
Before we begin, we will have to set a parameter for our subscriptionId. Since this is a Parameter the value can easily be changed when the Logic App is redeployed in another subscription.
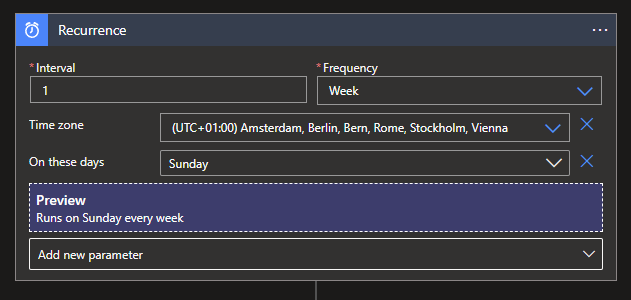
To start our flow we will setup a simple Recurrence trigger, running it once a week on Sunday. You can configure a specific time if needed, else it will run on the time your Logic App was published.
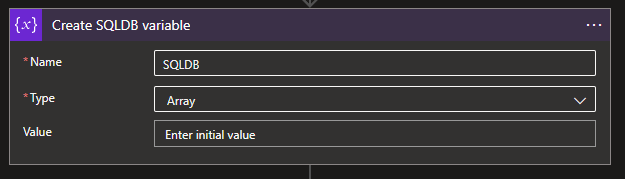
Next up is a Array variable. This variable is needed to capture all possible database metrics available, instead of a single one. Give it a logical name and select the Array type.
As stated it is possible to have multiple of these flows all together in a single Logic App to measure all your different compute resources. To make this more clear in your flow, use a Scope action to containerise the flow to the specific scope like in this example: Azure SQL Databases.

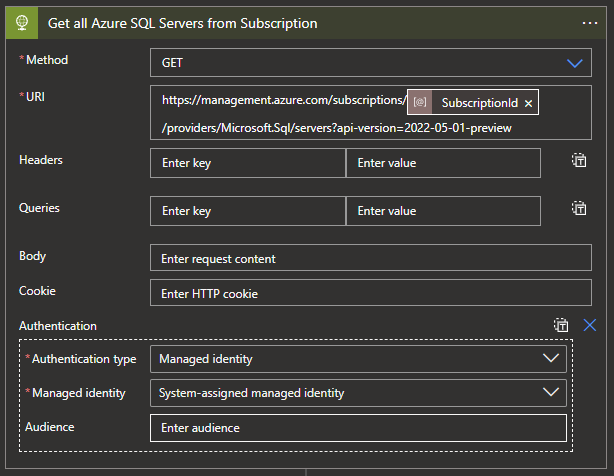
Next up we will need to start gathering the required data to get to our Database metrics. For this we will first need to gather all SQL Servers within our subscription. For this we will need a HTTP action with the following settings:
Methode: GET
URI: https://management.azure.com/subscriptions/@{parameters('SubscriptionId')}/providers/Microsoft.Sql/servers?api-version=2022-05-01-preview
Authentication type: Managed identity
Managed Identity: System-assigned managed identity
Our next action will be to Loop through all the SQL Servers. For this we will need a For Each action with the following expression:
body('Get_all_Azure_SQL_Servers_from_Subscription')?['value']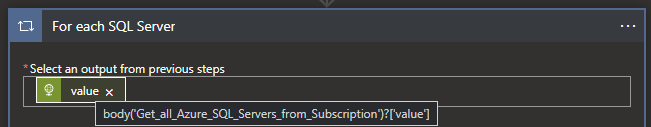
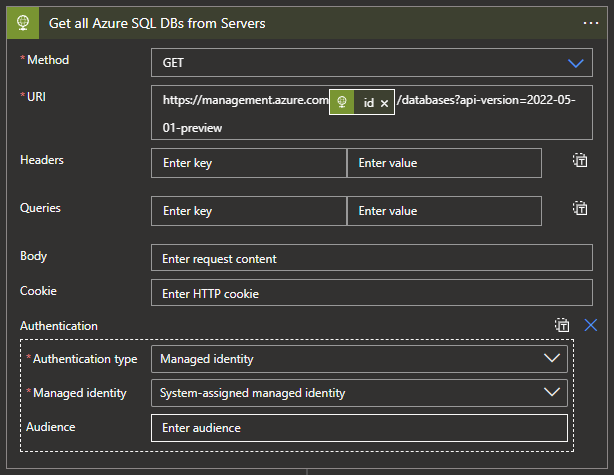
Now that we are able to loop through our SQL Servers we can start to get all SQL Databases available within the SQL Servers. For this we will need another HTTP action with the following settings:
Methode: GET
URI: https://management.azure.com@{items('For_each_SQL_Server')?\['id']}/databases?api-version=2022-05-01-preview
Authentication type: Managed identity
Managed Identity: System-assigned managed identity
The following step is optional, but to make a clean report it can be usefull. As it is possible to have a Dedicated SQL Pool (Formerly SQL Datawarehouse) inside of a SQL Server instead a Synapse Workspace it would be wise to filter them out, just like System databases, if you purely want to look a SQL Databases. This can be done by adding a Filter action with the following expression:
body('Get_all_Azure_SQL_DBs_from_Servers')?['value']And the follow expression to apply the filtering of removing Dedicated SQL Pools from the list:
@and(not(equals(item()?['sku']?['tier'], 'DataWarehouse')),not(equals(item()?['sku']?['tier'], 'System')))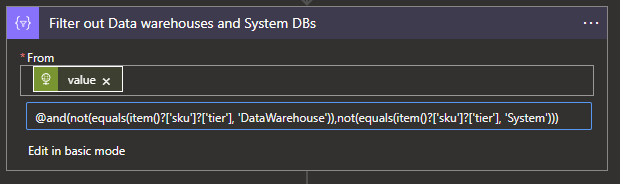
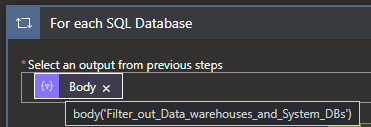
Now that we have all our SQL Databases available, we will need to loop through each of them to request their metrics. For this we will need another For Each action with the following expression:
body('Filter_out_Data_warehouses_and_System_DBs')
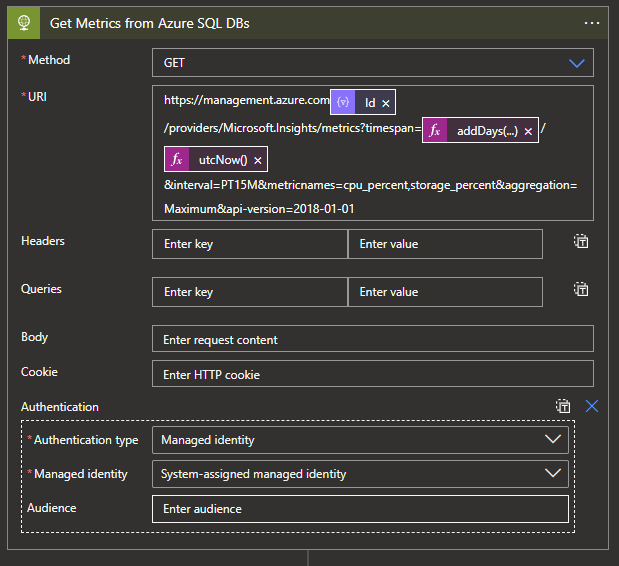
For our last HTTP action we will need to get the Metrics of our SQL Databases, this we can do with the following settings:
Methode: GET
URI: https://management.azure.com@{items('For_Each_SQL_Database')?['Id']}/providers/Microsoft.Insights/metrics?timespan=@{addDays(utcNow(),-30)}/@{utcNow()}&interval=PT15M&metricnames=cpu_percent,storage_percent&aggregation=Maximum&api-version=2018-01-01
Authentication type: Managed identity
Managed Identity: System-assigned managed identity
In this example I'm looking at intervals of 15 minutes in timespans of 30 minutes. The Metrics I'm looking for is CPU percentage and Storage percentage, as these give a good indication if the Compute is under or over utilised, just as well for the Storage capacity.
If you are using this for another compute resource, it will be possible these metrics are called different. But these can easily be checked within the Metrics tab inside the Azure Portal for the specific resource you are configuring the flow for.
With our Metrics gathering in place, we will now have to do a but of filtering and transformations to get the Data in the right format for our Database for which we already created the SQL Stored Procedure earlier. To start this we will need a Select Action with the following expression:
body('Get_Metrics_from_Azure_SQL_DBs')?['value']?[0]?['timeseries']?[0]?['data']And the following mapping:
if(equals(item()?['maximum'],null),0,item()?['maximum'])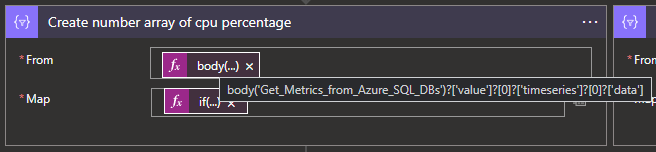
This we can also do in Parallel with another Select action to filter on the storage percentage.
body('Get_Metrics_from_Azure_SQL_DBs')?['value']?[1]?['timeseries']?[0]?['data']With the following mapping:
if(equals(item()?['maximum'],null),0,item()?['maximum'])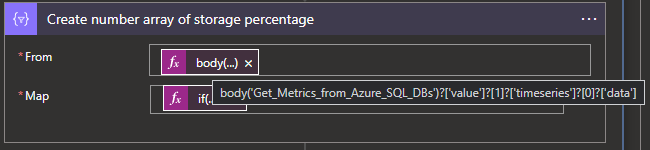
As the above mappings create arrays with all percentages in it, we will need to a bit of Data cleansing to make sure we will have all Numbers to work with instead of values like NULL. For this we will need another Select action to filter on the output of the CPU percentage mapping, use the following expression:
body('Get_Metrics_from_Azure_SQL_DBs')?['value']?[0]?['timeseries']?[0]?['data']Use this expression for the mapping:
if(equals(item()?['maximum'],null),0,item()?['maximum'])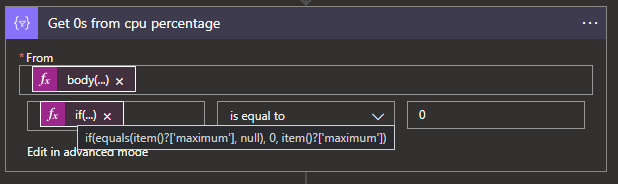
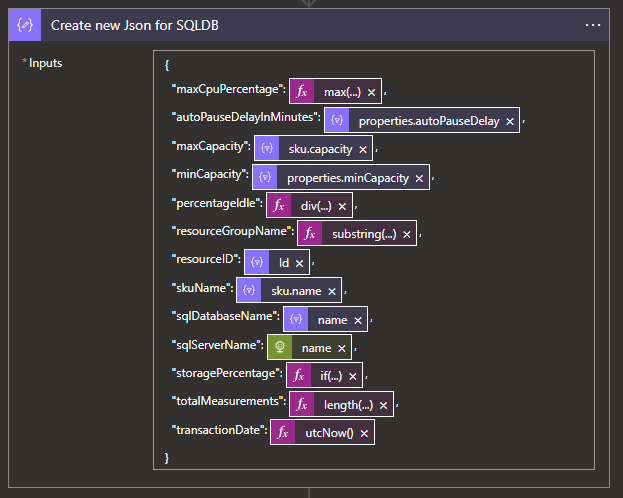
Now that our Metrics data is filtered, cleansed and ready for processing, we will only need to transform it in the right format for our Database to store it. For this we can use a Parse JSON action with the following expression:
{
  "autoPauseDelayInMinutes": @{items('For_Each_SQL_Database')?['properties']?['autoPauseDelay']},
  "maxCapacity": @{items('For_Each_SQL_Database')?['sku']?['capacity']},
  "maxCpuPercentage": @{max(body('Create_number_array_of_cpu_percentage'))},
  "minCapacity": @{items('For_Each_SQL_Database')?['properties']?['minCapacity']},
  "percentageIdle": @{div(mul(length(body('Get_0s_from_cpu_percentage')),100),length(body('Create_number_array_of_cpu_percentage')))},
  "resourceGroupName": @{substring(items('For_Each_SQL_Database')?['Id'],add(indexOf(items('For_Each_SQL_Database')?['Id'],'resourceGroups/'),15),sub(sub(indexOf(items('For_Each_SQL_Database')?['Id'],'/providers'),indexOf(items('For_Each_SQL_Database')?['Id'],'resourceGroups/')),15))},
  "resourceID": @{items('For_Each_SQL_Database')?['Id']},
  "skuName": @{items('For_Each_SQL_Database')?['sku']?['name']},
  "sqlDatabaseName": @{items('For_Each_SQL_Database')?['name']},
  "sqlServerName": @{items('For_each_SQL_Server')?['name']},
  "storagePercentage": @{if(equals(last(body('Create_number_array_of_storage_percentage')),null),0,last(body('Create_number_array_of_storage_percentage')))},
  "totalMeasurements": @{length(body('Create_number_array_of_cpu_percentage'))},
  "transactionDate": @{utcNow()}
}
The above expression will apply all the needed transformations and format changes to get the required data just the way we needed it.
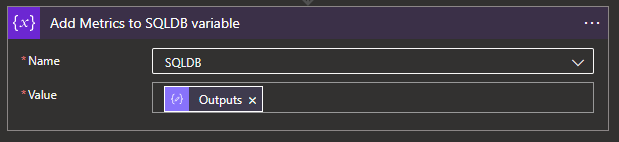
With the whole transformation complete we will now have to capture all JSON outputs for these Metrics per SQL Database in a single JSON output. For this we will use our earlier created Array variable inside of a Append to Array action. Use the following expression to capture all outputs:
outputs('Create_new_Json_for_SQLDB')With this our For Each Database part is completed and we can continue outside of it.
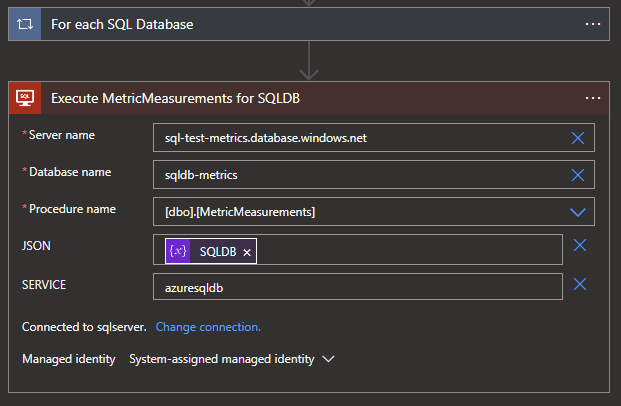
Last but certainly not least, we will need to create our Database interaction by creating a Execute SQL Stored Procedure V2 Action after the whole For each Database action.
Use the following settings for your SQL Stored Procedure action:
Server name: {your server name}.database.windows.nl
Database name: {your database name}
Procedure name: [dbo].[MetricMeasurements]
Click on Add new parameter and Add both the JSON and SERVICE parameters.
JSON: variables('SQLDB')
SERVICE: azuresqldb
With the SQL Stored Procedure action configured, your flow is ready and you can run it for your SQL Databases. Extent the flow to also include you Dedicated SQL Pools, VMs, Web Apps, Serverless SQL Pools, Databricks clusters, etc. Hope this helps you out in discovering the Utilisation of your Azure resources!
What's next?
Coming weeks are quite busy and while working on multiple solutions which might be interesting to blog about, I'm not sure yet what it would bring. So stay tuned to the next blog and be surprised!